Nevron Vision for SharePoint
Nevron Vision for SharePoint
Advanced dashboards and reports inside the browser
Nevron Vision for SharePoint
Nevron Vision for SharePoint
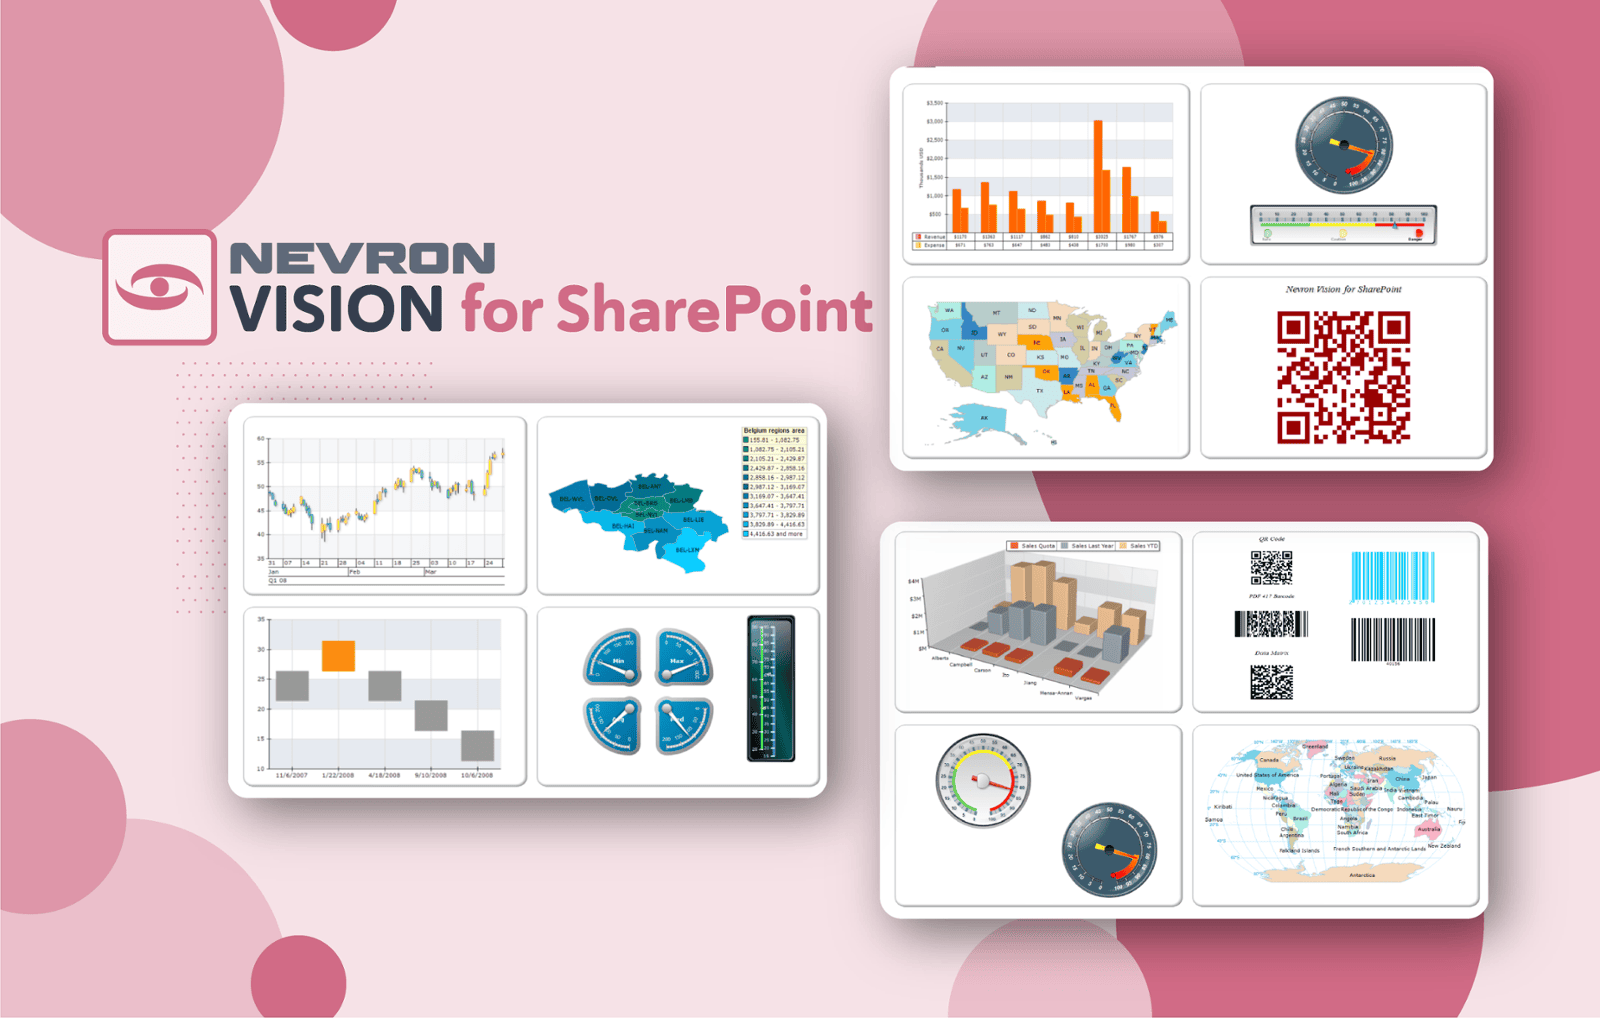
Nevron Vision for SharePoint delivers the web parts needed to author advanced reports and dashboards inside any SharePoint page – and what is best – you do not need to be a developer to do that.
Leveraging years of experience, Nevron Vision for SharePoint delivers leading data visualization and unique know-how, which is simultaneously entirely visually configured through an exhaustive web-based interface. This makes it possible for developers and non-developers alike to take advantage of the flexibility and feature richness these web parts offer – directly inside the browser.
The web parts included in this suite can extract data from a diverse range of data sources, including various databases, SP Lists, SP Site Queries, Excel Services, and BDC. They are also equipped with a fast, reliable, and flexible data aggregation engine, which allows the authoring of complex dashboards and reports that perform sophisticated data analysis.
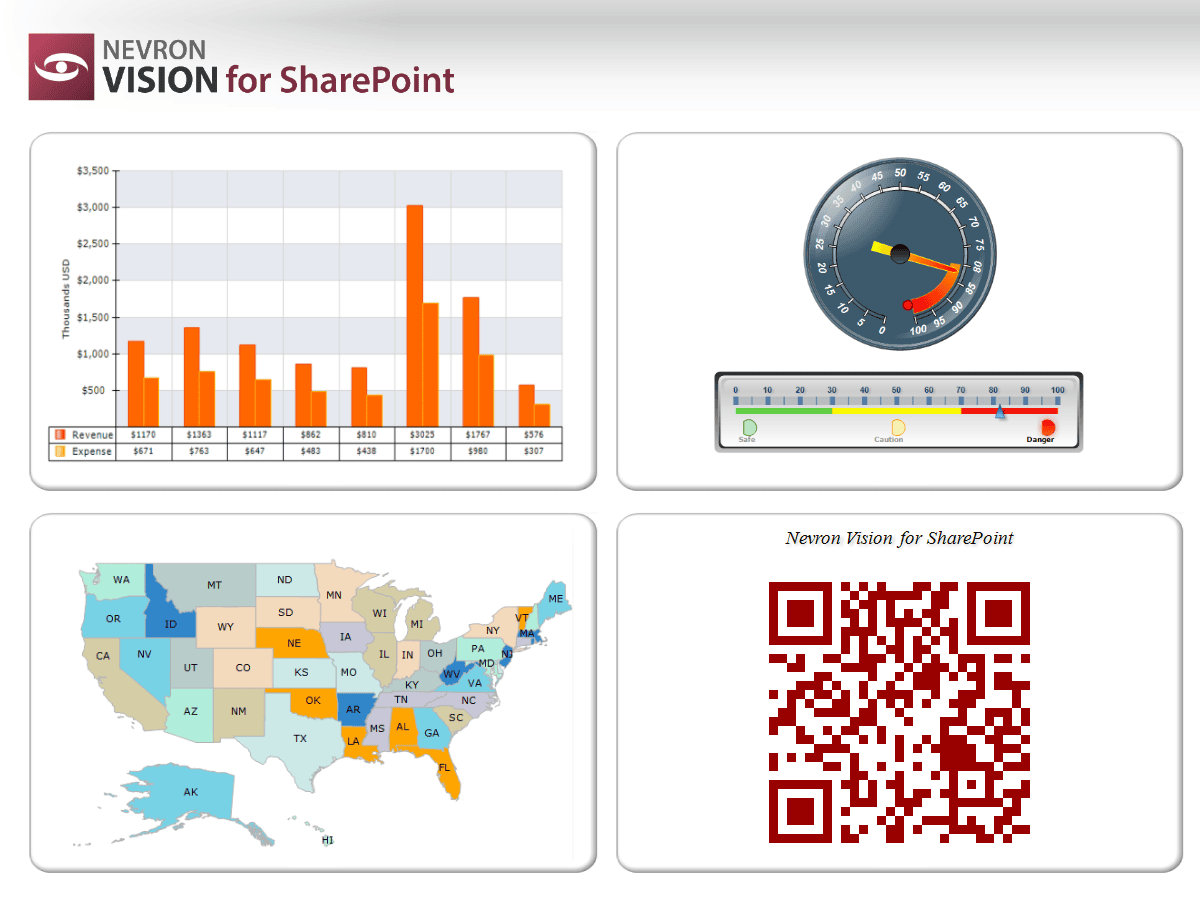
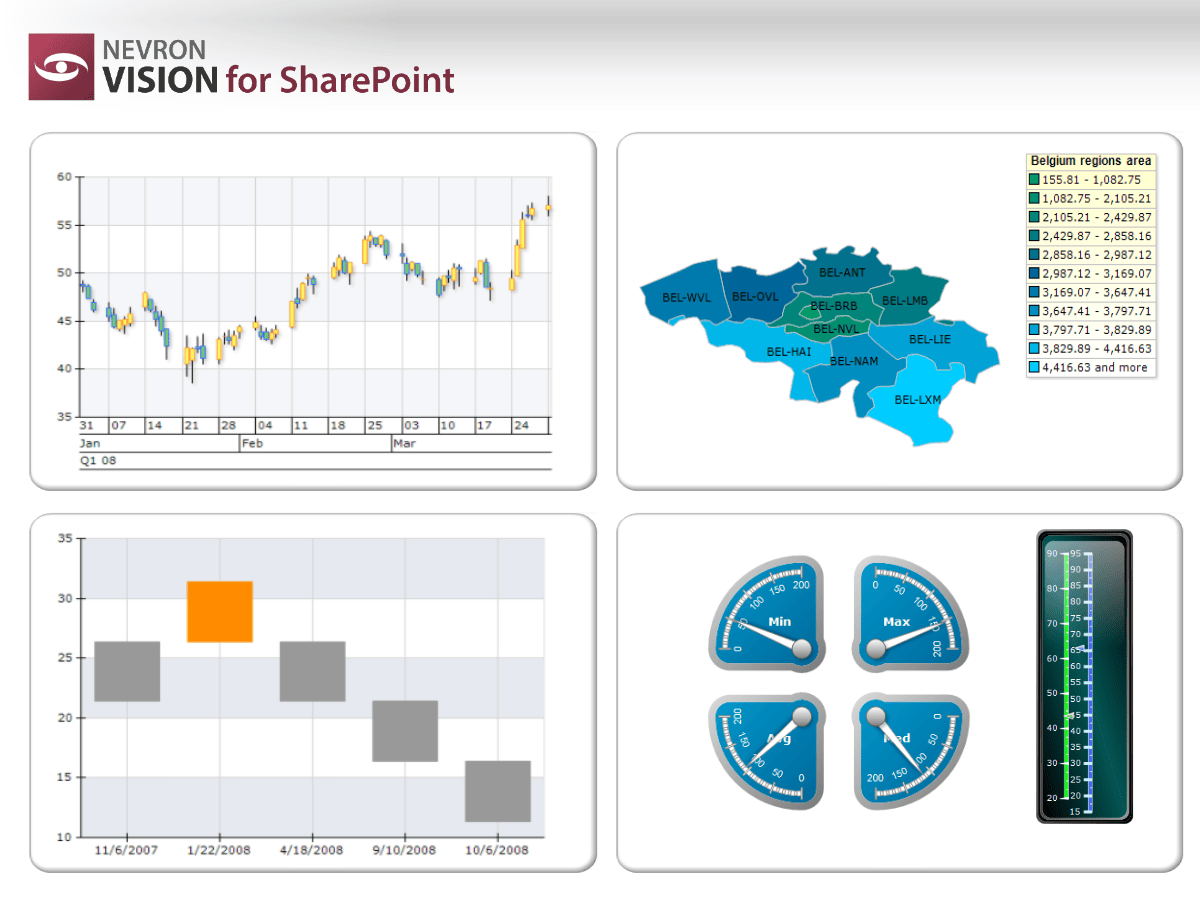
Nevron Vision for SharePoint is unique in the breadth of its offering – from simple charts and KPIs to sophisticated drill-down reports and dashboards – this suite of web parts delivers it all to you – the regular SharePoint user.
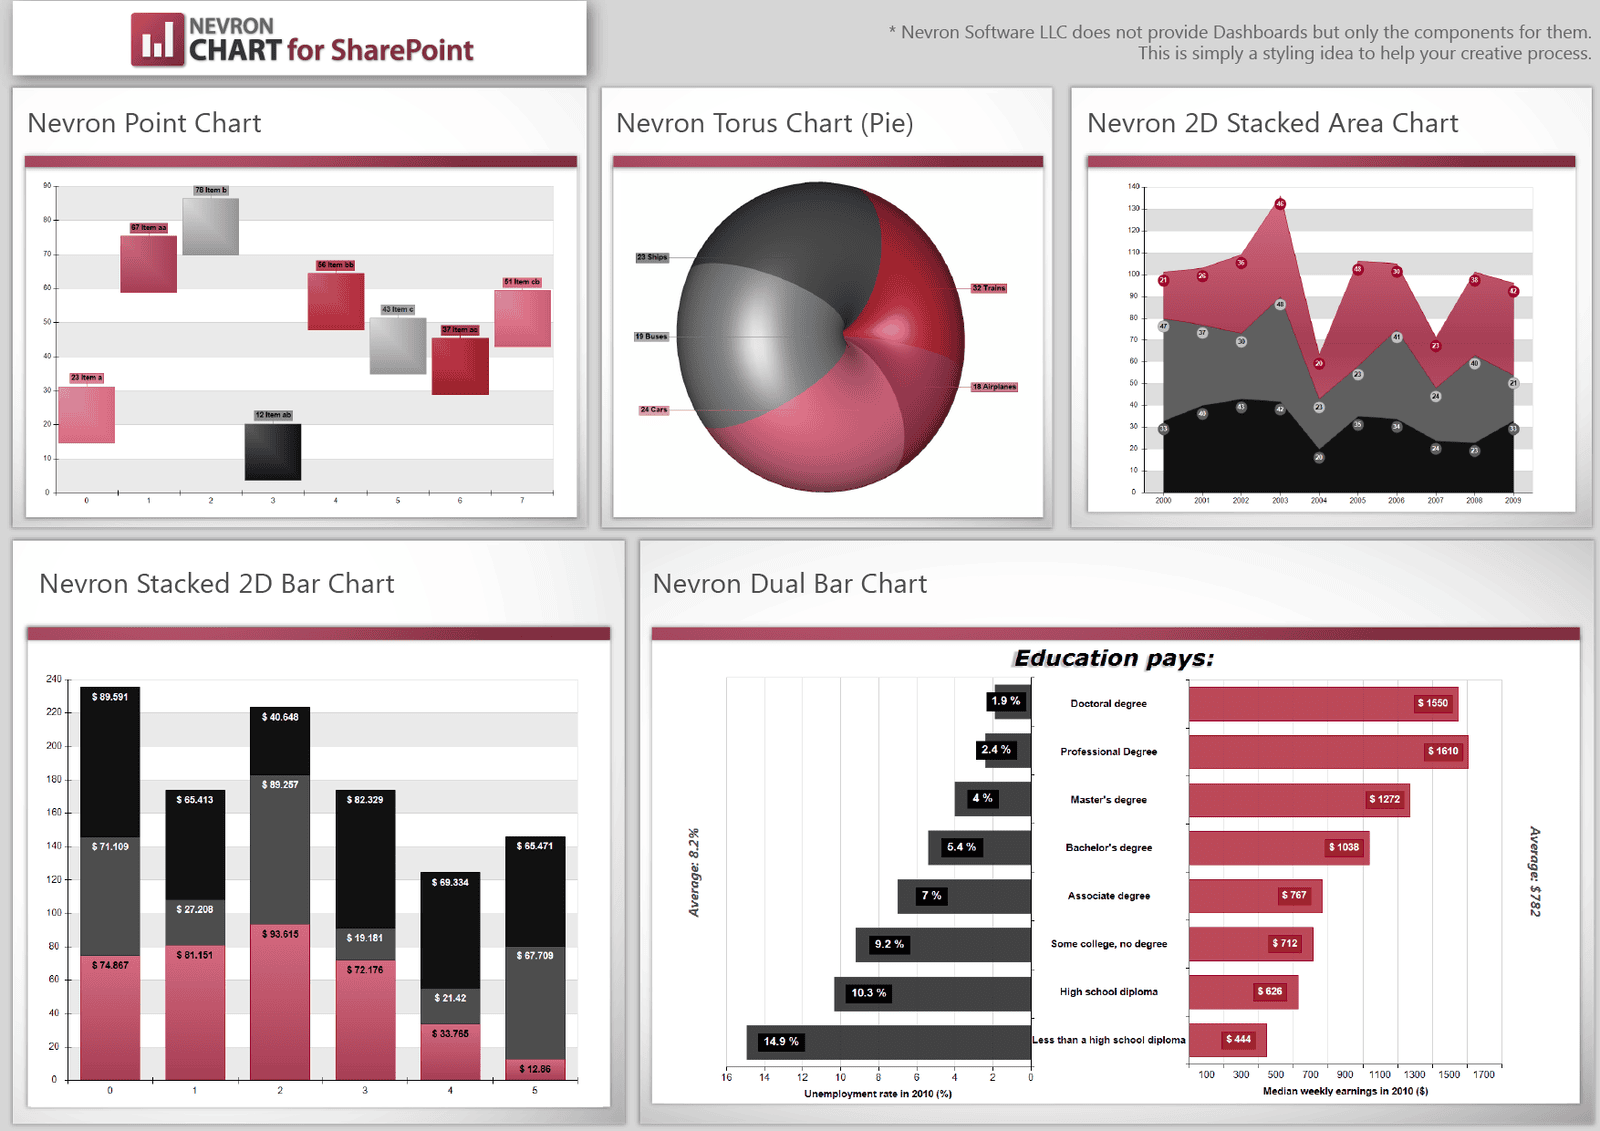
It combines the industry-leading Nevron Charting engine for ASP.NET with the powerful Nevron Pivot Data Aggregation engine. This allows for virtually any SharePoint user to visually create advanced pivot charts with truly unique and impressive looks. That is why it is considered to be the Microsoft Excel Pivot Chart analog in the SharePoint context.
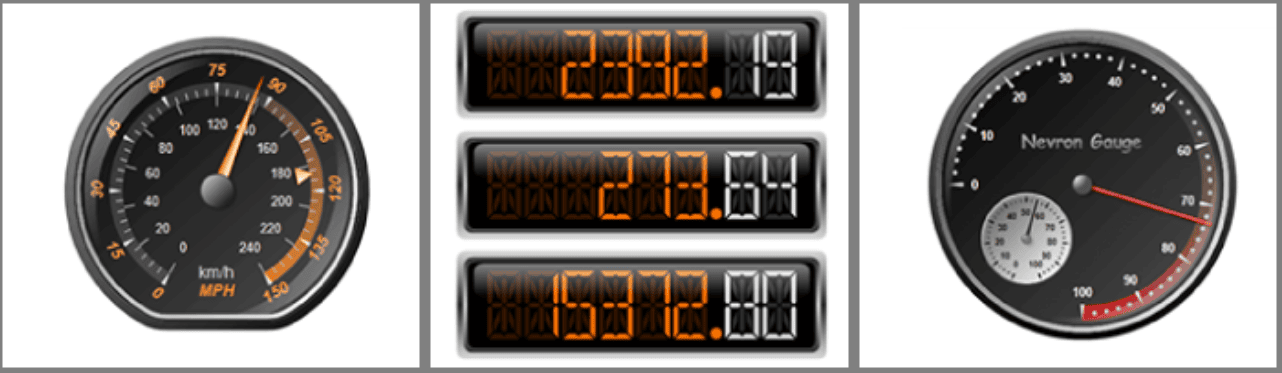

Nevron Gauge for SharePoint includes:
- Multiple Gauge Areas and Gauge Combinations
- Advanced Gauge Axis Model and Scales Configuration
- Advanced Pivot Data Aggregation
- Built-in gauge formulas for data analysis
- Advanced Gauge Editor, Visual Styling and Code Customization
- Binding to ODBC, OLEDB, SQLServer data sources
- Binding to Business Data Catalog and Excel Services
- Support for WSS3.0, SharePoint 2007, 2010, 2013, 2016, and 2019 ... And much more...
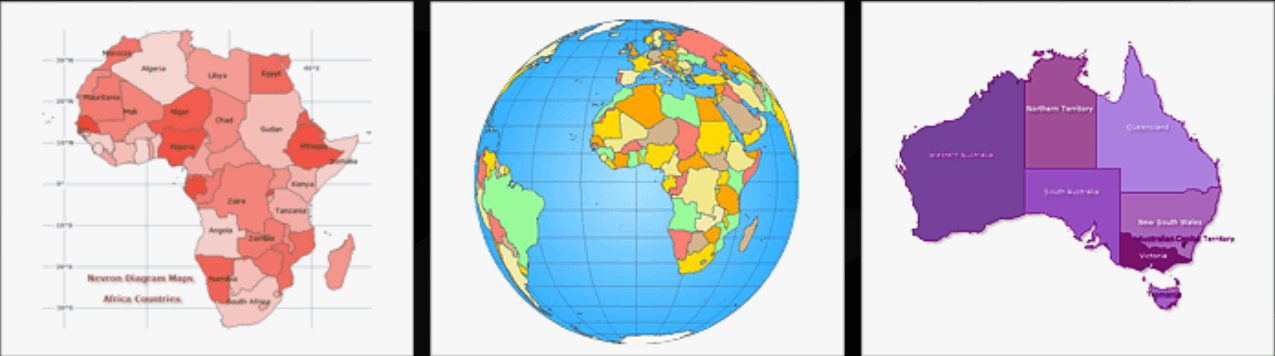

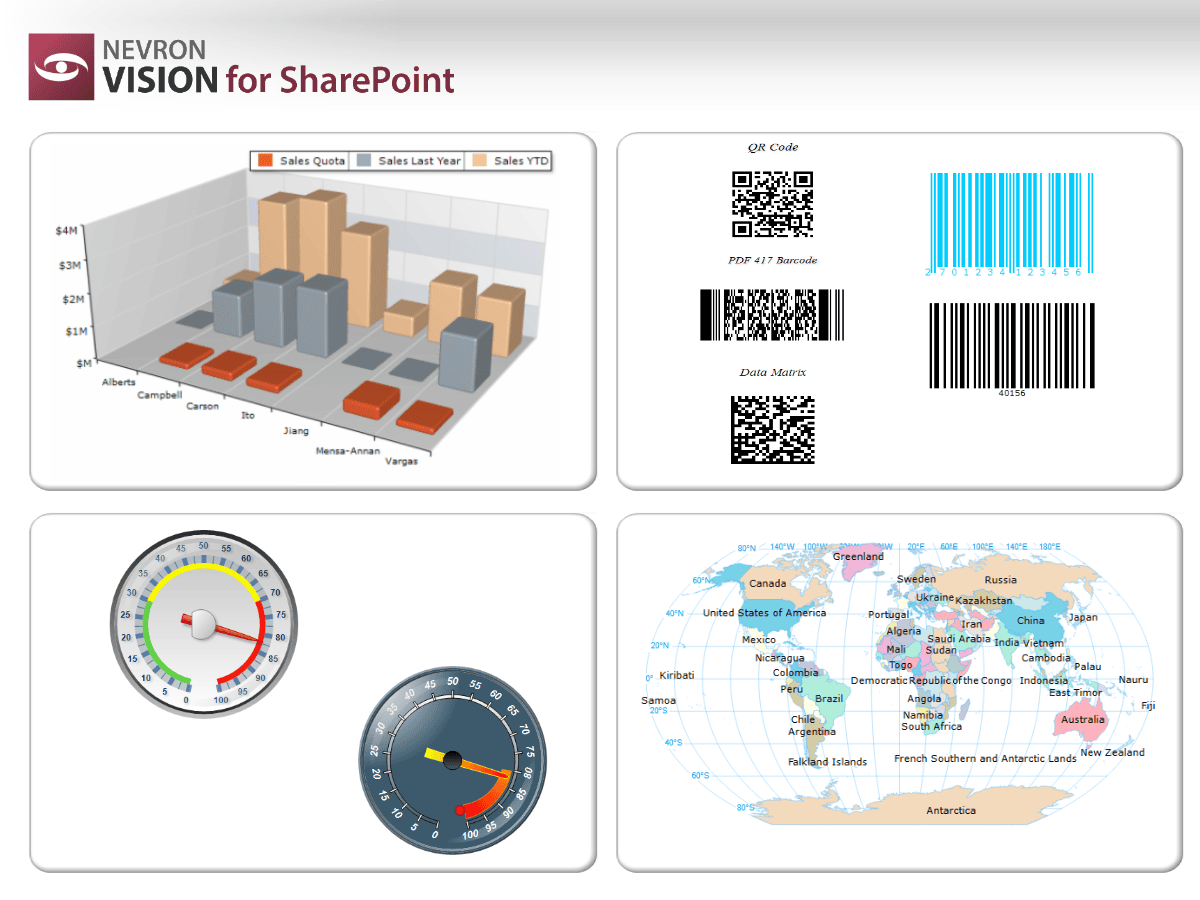
Nevron Map for SharePoint features:
- Support for predefined and custom ESRI maps
- Support for multiple layers, legends and titles
- Advanced data binding to your data
- 22 map projections
- Data driven filling and styling
- Map zooming, scrolling and centering
- Seamless integration with WSS3.0, SharePoint 2007, 2010, 2013, 2016, and 2019
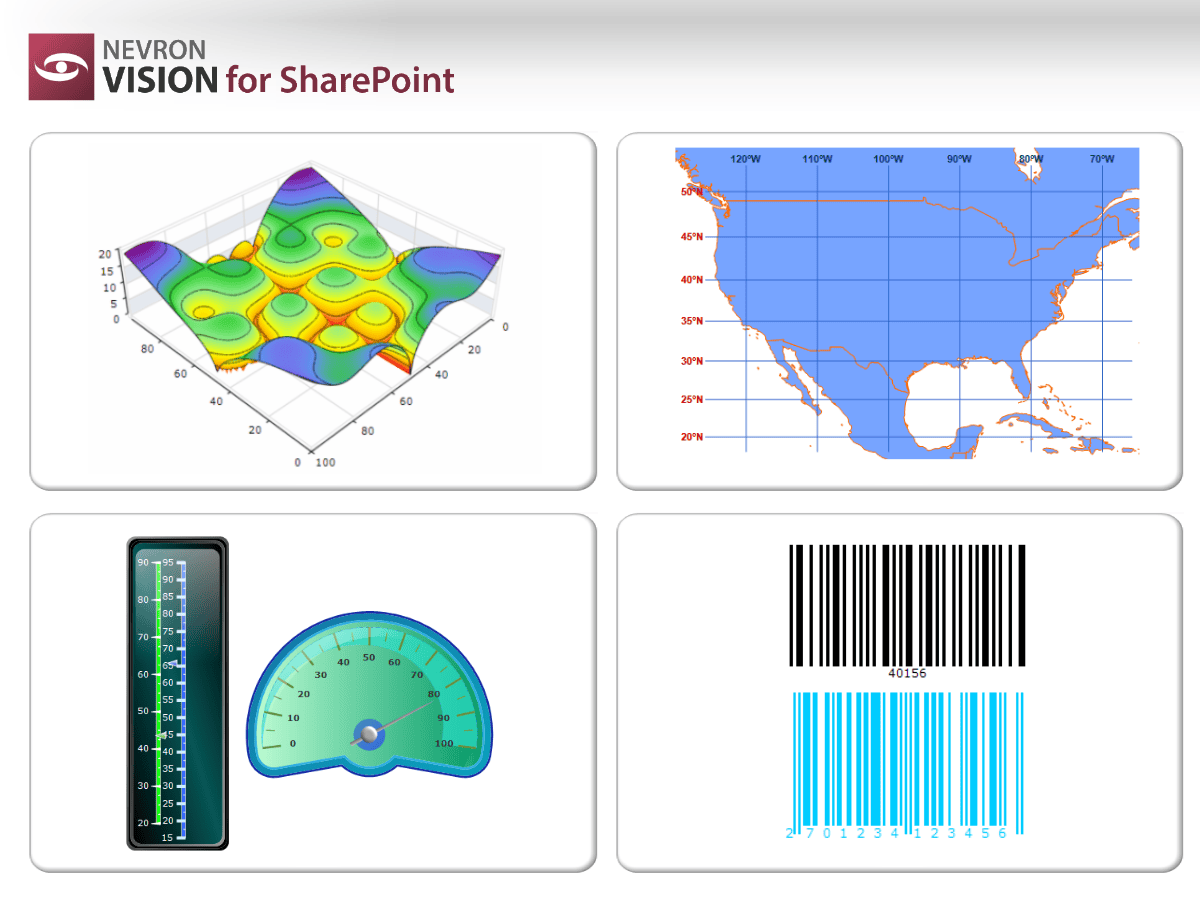
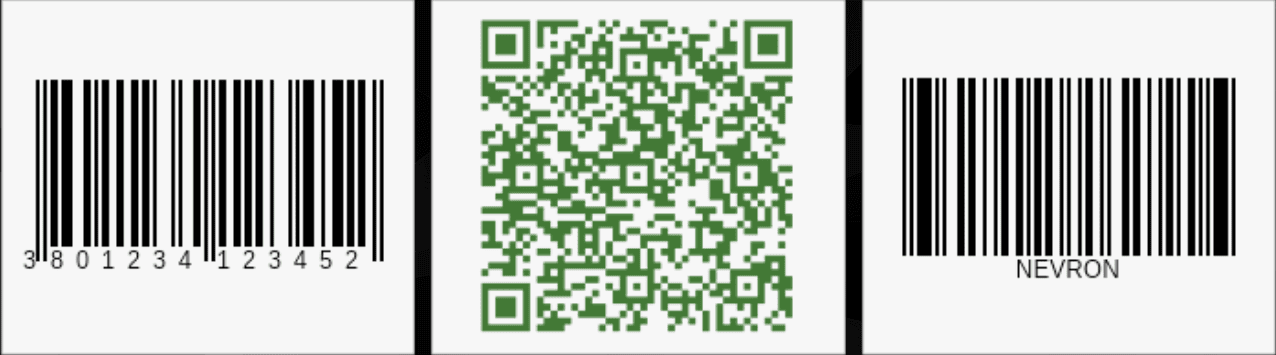
If you want to integrate barcode visualization inside your SharePoint pages, Nevron Barcode for SharePoint is a perfect choice. It can display virtually all widely used barcode symbologies and is fully data-driven.
Nevron Barcode for SharePoint features:
- Support for multiple barcode areas and titles
- Support for 28 linear barcode symbologies, including: Codabar, Code 11, Code 39, Code 39 Extended, Code 93, Code 128, Code 128A, Code 128B, Code 128C, EAN8, EAN 13, FIM, Interleaved 2 of 5, ISBN, ITF14, JAN13, MSI 2Mod10, MSI Mod10, MSI Mod11, MSI Mod11 Mod10, Pharmacode, PostNet, Standard 2 of 5, Telepen, UPCA, UPCE, UPC Supplemental 2Digit and UPC Supplemental 5Digit.
- Support for QR Code Data Matrix and PDF417 matrix barcodes.
- Low, Medium, Quartile and High correction levels
- Integrated pixel snapping that displays barcode symbols at exact pixels.
- Seamless integration with WSS3.0, SharePoint 2007, 2010, 2013, 2016, and 2019